Originally published for customers May 10, 2023
What’s the issue?
Associated with the upcoming indexing season, pipeline companies are working through whether or not costs have kept pace with where inflation dragged FERC’s escalation factor over the past two years so that they can decide how much of the escalation they will take.
Why does it matter?
If pipeline companies exceed the Percentage Comparison Test by over 10%, they are opening themselves up to complaints from shippers, and potentially rate cases in the future.
What’s our view?
For many pipeline companies, costs have kept a close enough pace to PPI-FG that they can comfortably take the full escalation. For others outside the 10% threshold, we anticipate many will still seek the full escalation, but this will largely be driven by their proximity to that threshold and their history of complaints from shippers around rate increases.
Form 6s are fresh off the press, so we are digging through them and gearing up for indexing season. As a reminder, a large majority of indexed rates are set to change this summer, so regulatory and commercial teams are preparing to file updated rates once the final PPI-FG figures come out later this month. From there, updated tariffs will be filed before June 1st, reflecting rate changes effective on or after July 1st.
The escalation for 2022-2023 came in at a historic 8.7%, driven predominately by inflation in the current economic cycle. We estimate the 2023-2024 escalation will break that record with an anticipated double digit move, again driven entirely by inflation (more on that here). Given these back-to-back record escalations, a big question on everyone’s mind is did pipelines’ costs actually go up that much? And if they did not, are any pipelines seeking the full escalation at risk of shipper complaints or even a rate case?
To answer these questions, let’s dive into the Page 700s. The primary areas we’ll look into today are Operating and Maintenance Expense (Line 1), Rate of Return – Real Cost of Stockholders’ Equity (Line 6d), Total Cost of Service (Line 9), and Total Interstate Operating Revenues (Line 10). As a side note, if you ever find yourself trying to scrounge up this data quickly for your own analysis, don’t forget that we’ve already taken the time to scrape it and structure it all for you within our Liquids Commerce Platform. Reach out if you would like to learn more about how we can help support you and your team locate and leverage this data.
We are still waiting on the finalized escalation figure from FERC, but for now, we will use 13.3% for our calculations. For this analysis, we will look at companies with over $25 million in Interstate Operating Revenues. Diving in, the chart below shows the year-over-year percentage change for pipeline companies’ Operating and Maintenance (O&M) expenses as well as their reported Cost of Service. For many pipelines in 2022, we can clearly see that costs went up. There are some outliers, but in general, we see that O&M expense tracks Cost of Service directionally.
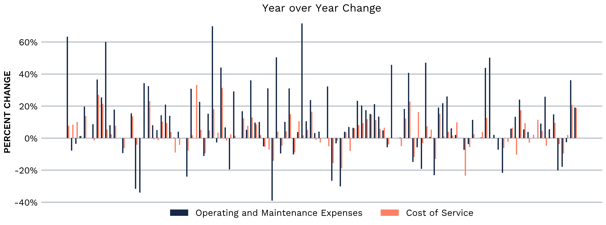
Since we’re dealing with percentage changes on different categories (O&M vs. Cost of Service) with different sized dollar figures, don’t get too caught up on the percentage variances between these two data points presented here. The main story in the chart above is that both metrics are trending upwards, indicating that costs grew year-over-year.
Based on the graph above, we can clearly see that the majority of pipeline companies’ costs went up in 2022. Looking at the graph below, we’ll find year-over-year percentage changes for Interstate Operating Revenues and O&M Expenses also increased. For the majority of pipeline companies, there is a common trend below in that the percentage change in O&M Expense and Interstate Operating Revenue trend directionally together. This, at least in part, could be attributed to an assumption that increased volumes drive up both revenues (at least hopefully!) and O&M expenses.
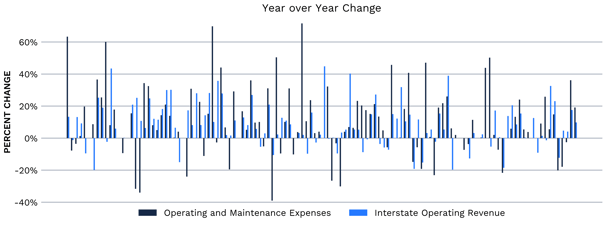
The big takeaway here is that O&M costs grew at a faster rate than Interstate Operating Revenues did for many pipelines last year. Again, since we’re starting from different points, this graph should not be interpreted to show that companies’ costs outpaced their revenue; it simply shows costs had more momentum year-over-year than revenue.
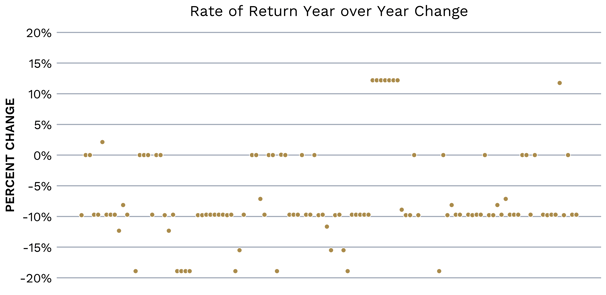
Our data up to this point highlights that pipeline companies’ costs are going up. The Rate of Return - Real Cost to Stockholders’ Equity is the last piece of data from the Page 700 worth mentioning to drive this message home. Looking at the graph below, you can clearly see that this metric dropped for many pipeline companies year-over-year. This is another data point that helps us answer our first question around whether costs did go up, with the answer being yes.
So we’ve answered our first question: pipeline company’s costs have gone up. But did they go up enough to warrant these headline-grabbing escalations, and are companies at risk of exposing themselves to shipper complaints in the near future if they take the full escalation? To answer that question, we’ll look at the Percentage Comparison Test. This test is a way for FERC and others to keep an eye on tariff rate increases to make sure rates are not getting unreasonably high at shippers’ expense.
To perform this test, we simply compare the Cost of Service’s year-over-year percentage change against the upcoming escalation. In our case, we’ll use our estimated 13.3% since we’re waiting on the finalized escalation from FERC, which should come out later this month. As long as the difference between the escalation and a pipeline company’s percentage change in their cost of service is within 10%, they can sleep soundly knowing they do not need to worry about any shippers filing a complaint against them for their rate increases.
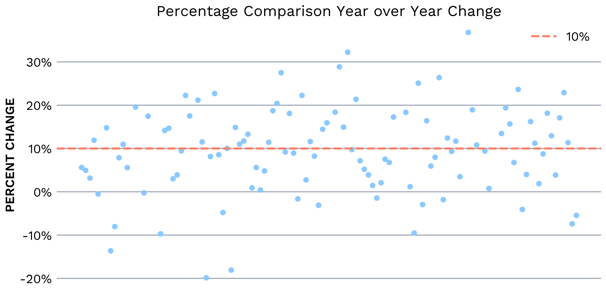
Based on the graph above, roughly 52% of pipeline companies fall comfortably within that 10% threshold where they do not need to worry about any complaints after taking the full escalation. For the remaining 48%, it is a sliding scale of risk based on how far out they are from that 10% threshold. For many pipeline companies sitting just above the 10% threshold, they (and their shippers) will no doubt be anxiously watching to see where FERC’s final escalation figure shakes out. It’s worth noting that this test only applies to companies using indexed rates, not market based rates.
Costs have clearly gone up for pipeline companies based on the data in this year's page 700s. This analysis takes some of the bite out of the eye popping FERC escalation figures we are anticipating, and highlights how inflation can impact the pipeline industry’s revenue and expense. From an indexing perspective, just over half of pipeline companies we looked at today should be able to comfortably take the anticipated full escalation without concern of shippers filing complaints. For those outside of the 10% threshold, we still anticipate many will seek to take the full escalation. A company’s appetite for risk for shipper complaints will ultimately drive that decision, but the proximity to that 10% threshold and the pipeline’s history of shipper complaints will be two of the key drivers in that decision.