
Overview
The midstream assets of a major integrated energy company historically served a primary function of transporting volumes between its owned upstream and refining assets, and ultimately to downstream markets. For many years, adherence to industry trends and tariff best practices had been a tertiary priority.
When the pipeline organization was asked to complete an optimization project with the goal of increasing revenue, they turned to Arbo — the single source of current and historical North American tariffs for crude and liquids movements.
We curated a dataset of relevant competitors in markets of focus and layered in analysis by career experts in liquids pipeline tariffs. The ultimate deliverable provided a comprehensive breakdown of current and historic pipeline tariff rates and extra charges and included interactive tools the company could use to benchmark their current tariff practices and to make modifications based on insights driven by data. We quickly identified an opportunity for an incentive rate to add over $200,000 of the incremental revenue potential. This was a leading indicator that more revenue opportunities could be uncovered with the Arbo approach.
The Problem
Our client’s midstream group had always prioritized support of the company’s upstream and downstream assets, and the team had limited visibility into the competitive landscape. As a result, their tariff practices — structures, rates, charges, et cetera — had lagged behind industry trends.
In order to gain a clearer understanding of the markets they operated in and identify opportunities to capture revenue and/or market share, our customer needed comprehensive tariff data.
Effective liquids tariff data is publicly available, but decentralized. Pulling together enough for a complete benchmarking effort is a monumental task in and of itself, but tariff filings are not particularly standardized in structure, making it difficult to achieve clear, apples to apples comparisons.
The Solution
Arbo put its exhaustive liquids tariff dataset and experienced tariff team to work by building a tailored solution to meet the customer’s need for in-depth analysis and data-driven decision making.
Step one was querying and refining the data to establish a relevant peerset. Through an iterative process with our customer, we identified the key fields, geographic focus, and commodity types of interest. We then structured the data into three easy-to-use formats, so the customer could quickly compare rates and derive actionable insight.
The first format was an interactive table that enabled quick trend spotting in pipeline charges for specific segments, and the types of extra charges employed — a foundational tool for benchmarking research. The table allowed the customer to filter by several fields including origin/destination counties and states, jurisdiction, estimated pipe length, and more, to further refine the dataset as needed.
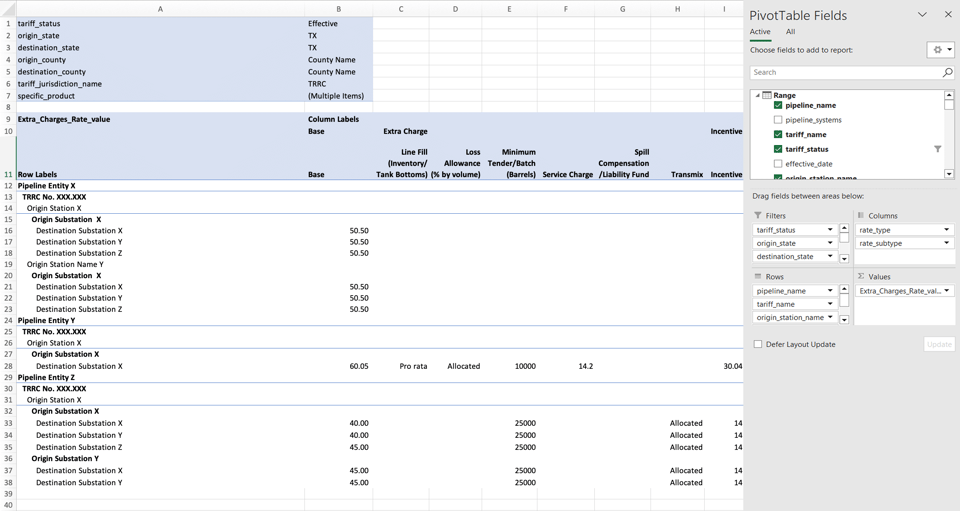
Arbo pulled relevant movements from our database of North American crude and liquids tariffs into a custom pivot tool for the customer team to uncover opportunities in corridors of interest.
The second file we delivered allowed for a more granular view of specific tariffs — in a spreadsheet the customer could easily filter and adjust to meet their specific needs. Within this spreadsheet, we included more information — like tariff heading types, available latitude, longitude and pipe diameters to name a few, as well as links back to the tariff and available dockets themselves so the customer could trace the data back to its source.
The final deliverable included interactive graphing of historical data to examine trends in rates and charges over time.


