Originally published for customers September 13, 2023
What’s the issue?
Power generation projects have become a critical component to the evolving energy production landscape of the United States.
Why does it matter?
From the pursuit of ambitious climate initiatives to the intricacies of commodity supplies and demands, the implementation of power generation, and the specific power generation technologies pursued, will have ripple effects throughout the industry.
What’s our view?
Yet, as we discuss today, we have a long way to go to make a meaningful impact on the current composition of power generation in the U.S., especially if the majority of projects continue to have their estimated operational dates delayed, with the average project being delayed several months, and in some cases, years.
New power generation projects are critical to the evolving energy production landscape of the United States. From the pursuit of ambitious climate initiatives to the intricacies of commodity supplies and demands, new power generation projects, and the specific power generation technologies pursued, will shape the industry. But with the average generation project being delayed several months, and in some cases, years, we have some significant obstacles to overcome if the current power generation landscape in the U.S. is to change.
Methodology
In order to quantify current and expected generation capacity as well as delays related to power generation facilities we analyzed the most recently available data from the U.S. Energy Information Administration (EIA), which collects information about existing and planned generators at electric power plants with one megawatt or greater of combined nameplate capacity on both an annual and monthly basis. We used this information to aggregate cumulative capacity additions as well as expected timelines. These filings primarily report nameplate capacity, offering a snapshot of the maximum potential output. In order to provide a more realistic analysis we cross referenced this data against the average observed “capacity factor” as provided by the EIA for each generator technology. The capacity factor takes into account how often different generator technologies typically operate in a given amount of time, offering a time-weighted capacity estimate that better reflects the project's real-world contribution to the energy grid.
Similarly, we have eliminated energy storage projects from our analysis. While these projects are critical to the future of our power grid, enabling the storage of power generated from wind and solar during times of low demand, these projects are not directly generating power themselves.
Operable Generator Composition
Before we delve into the specifics of planned and in-progress projects, it's essential to get a clear picture of the current landscape of operable power generation in the United States. Below, we break down the time-weighted capacity of currently operable generators in the United States by technology:
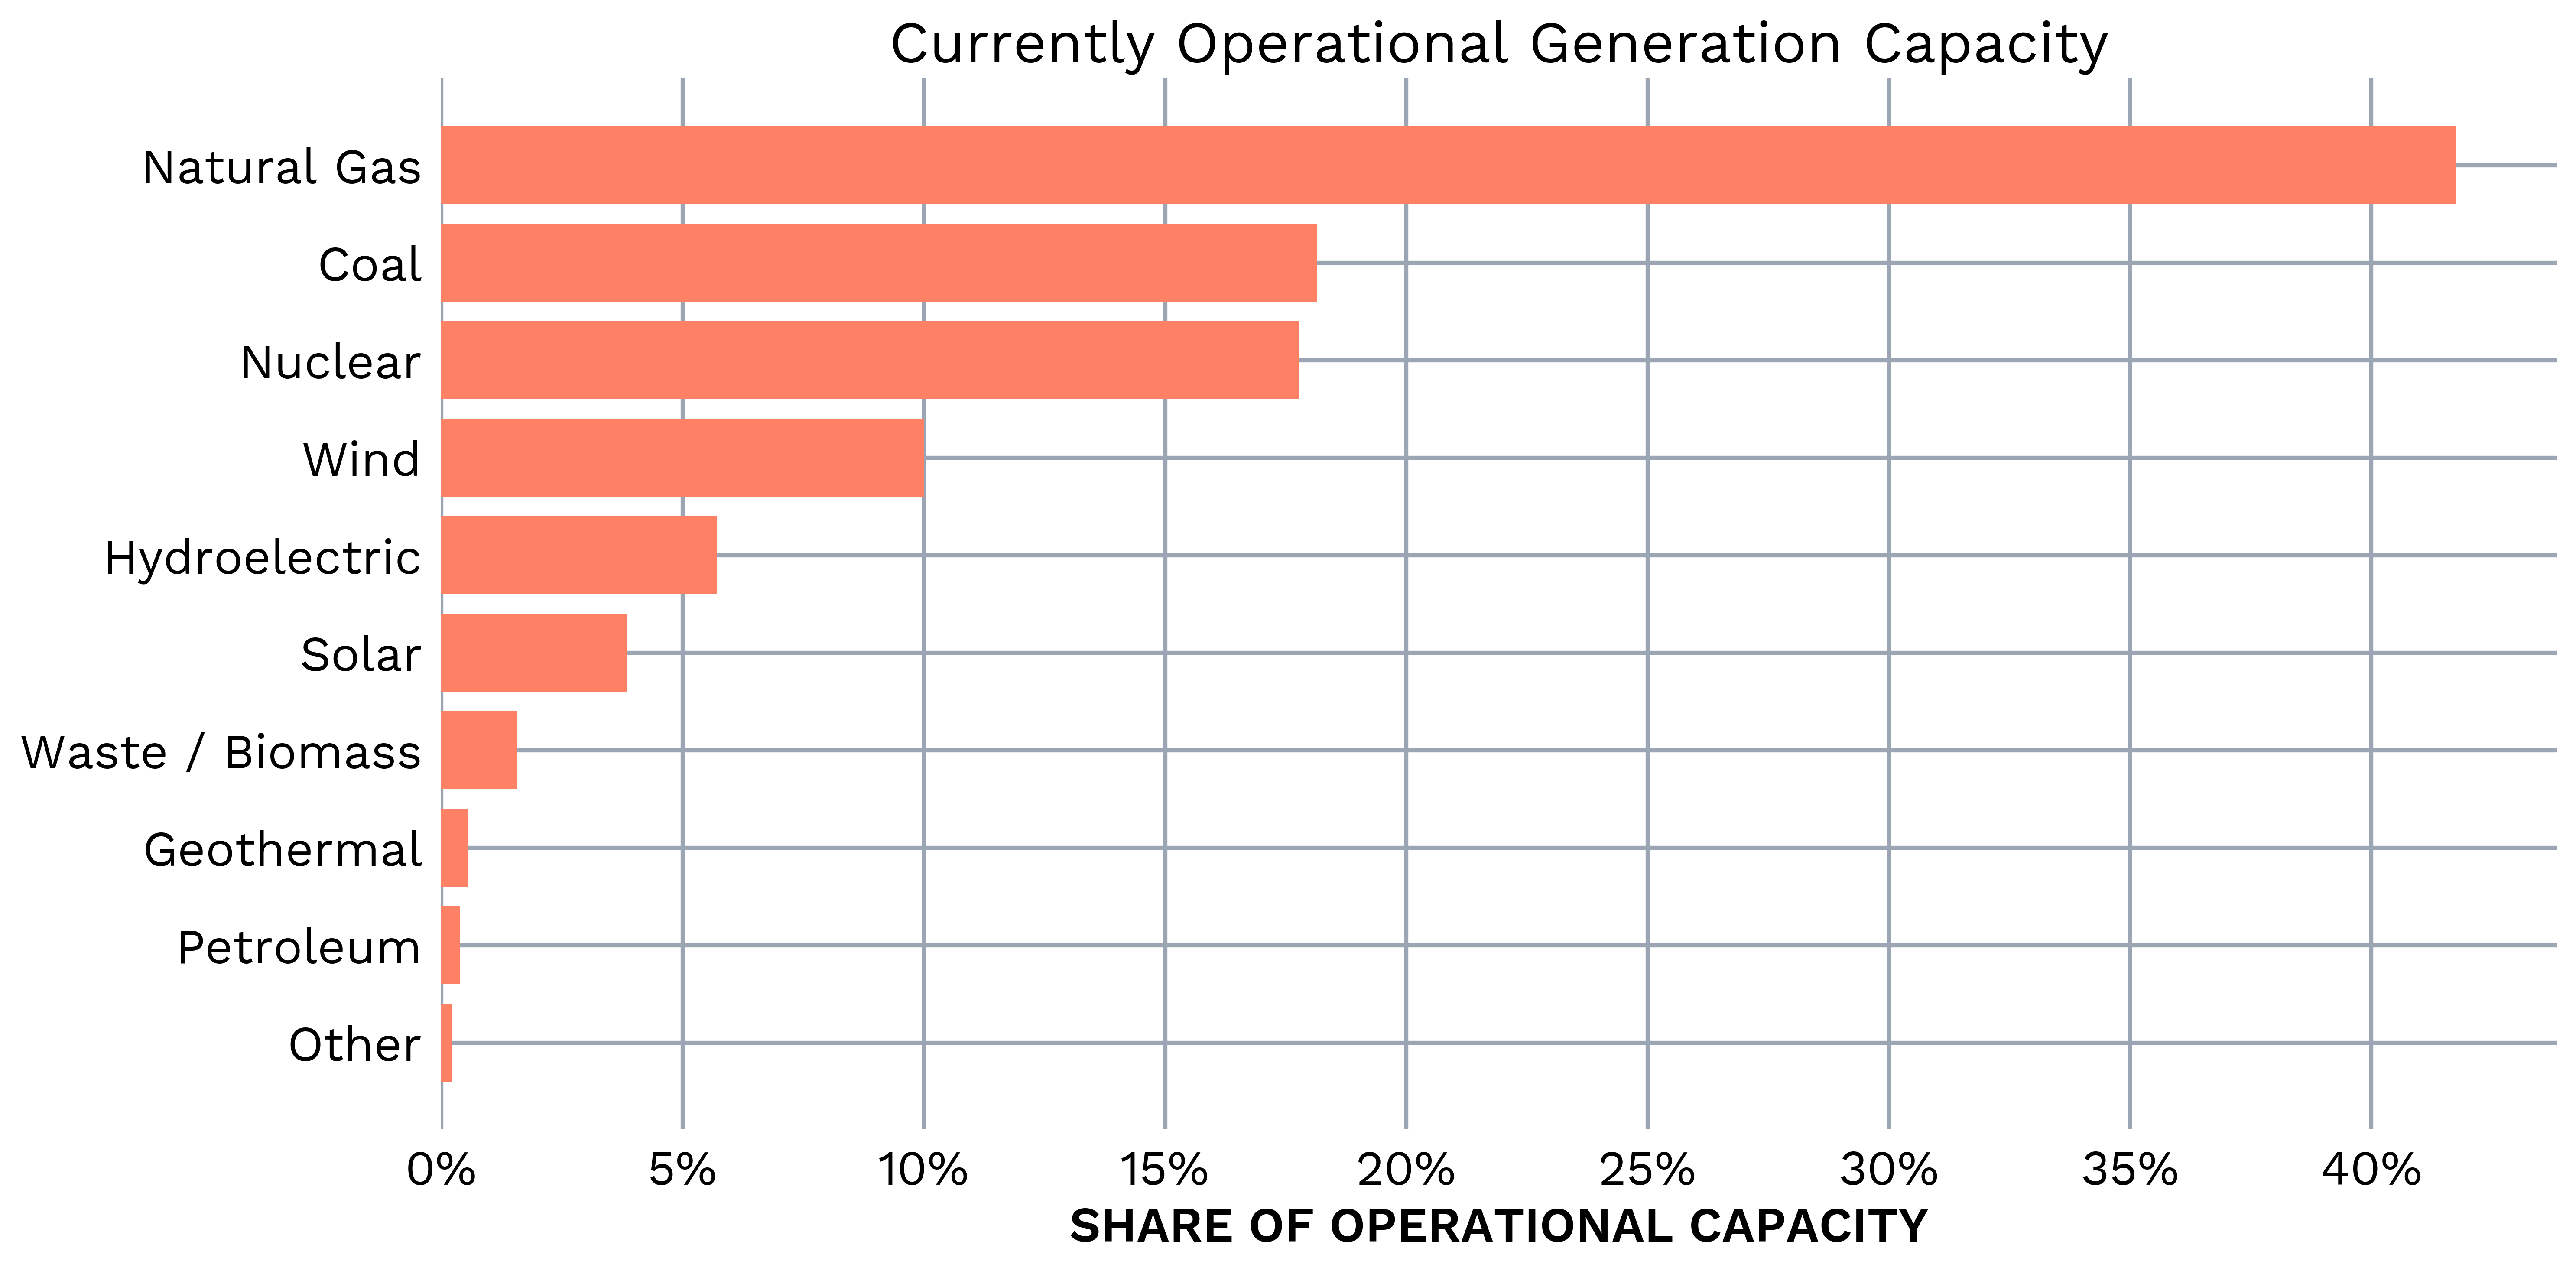
At first glance, the substantial percentage of coal and nuclear time-weighted capacity may be surprising, especially considering the lack of ongoing project development using these technologies, as described below. This can largely be attributed to their relatively high average capacity factors for the year 2022, which stood at 47.8% for coal and 92.6% for nuclear power. In relation to renewables, high capacity factors for natural gas were also observed, ranging from 13.6% to 56.7% depending on the specific technology. These high capacity factors make sense because coal, nuclear, and natural gas are often used to provide stable base-load generation.
Planned Capacity Additions
Using the estimated operational date for planned projects, as provided by project developers, we can analyze the cumulative expected capacity additions by technology type, as visualized in the line chart below:
91323.png?width=1300&height=700&name=FeaturedImage(3)91323.png)
The drastic difference in the composition of operable capacity and planned additional capacity is obvious. Wind and solar projects make up nearly 80% of all power generation project capacity that is currently in progress, whereas they constitute less than 15% of currently operable capacity. Natural gas projects claim only 16% of planned capacity, and nuclear constitutes just under 4%, leaving coal at 0. This highlights a major shift in the focus of power generation development, and poses the question as to how long until renewable generation becomes the predominant source of power in the United States? Our view is quite a while.
First of all, while renewables command the large majority of newly planned generation capacity, their planned capacity additions are relatively modest in the scope of all currently operable generation. Assuming all of the currently planned capacity is realized, our theoretical operational capacity composition would be the following:
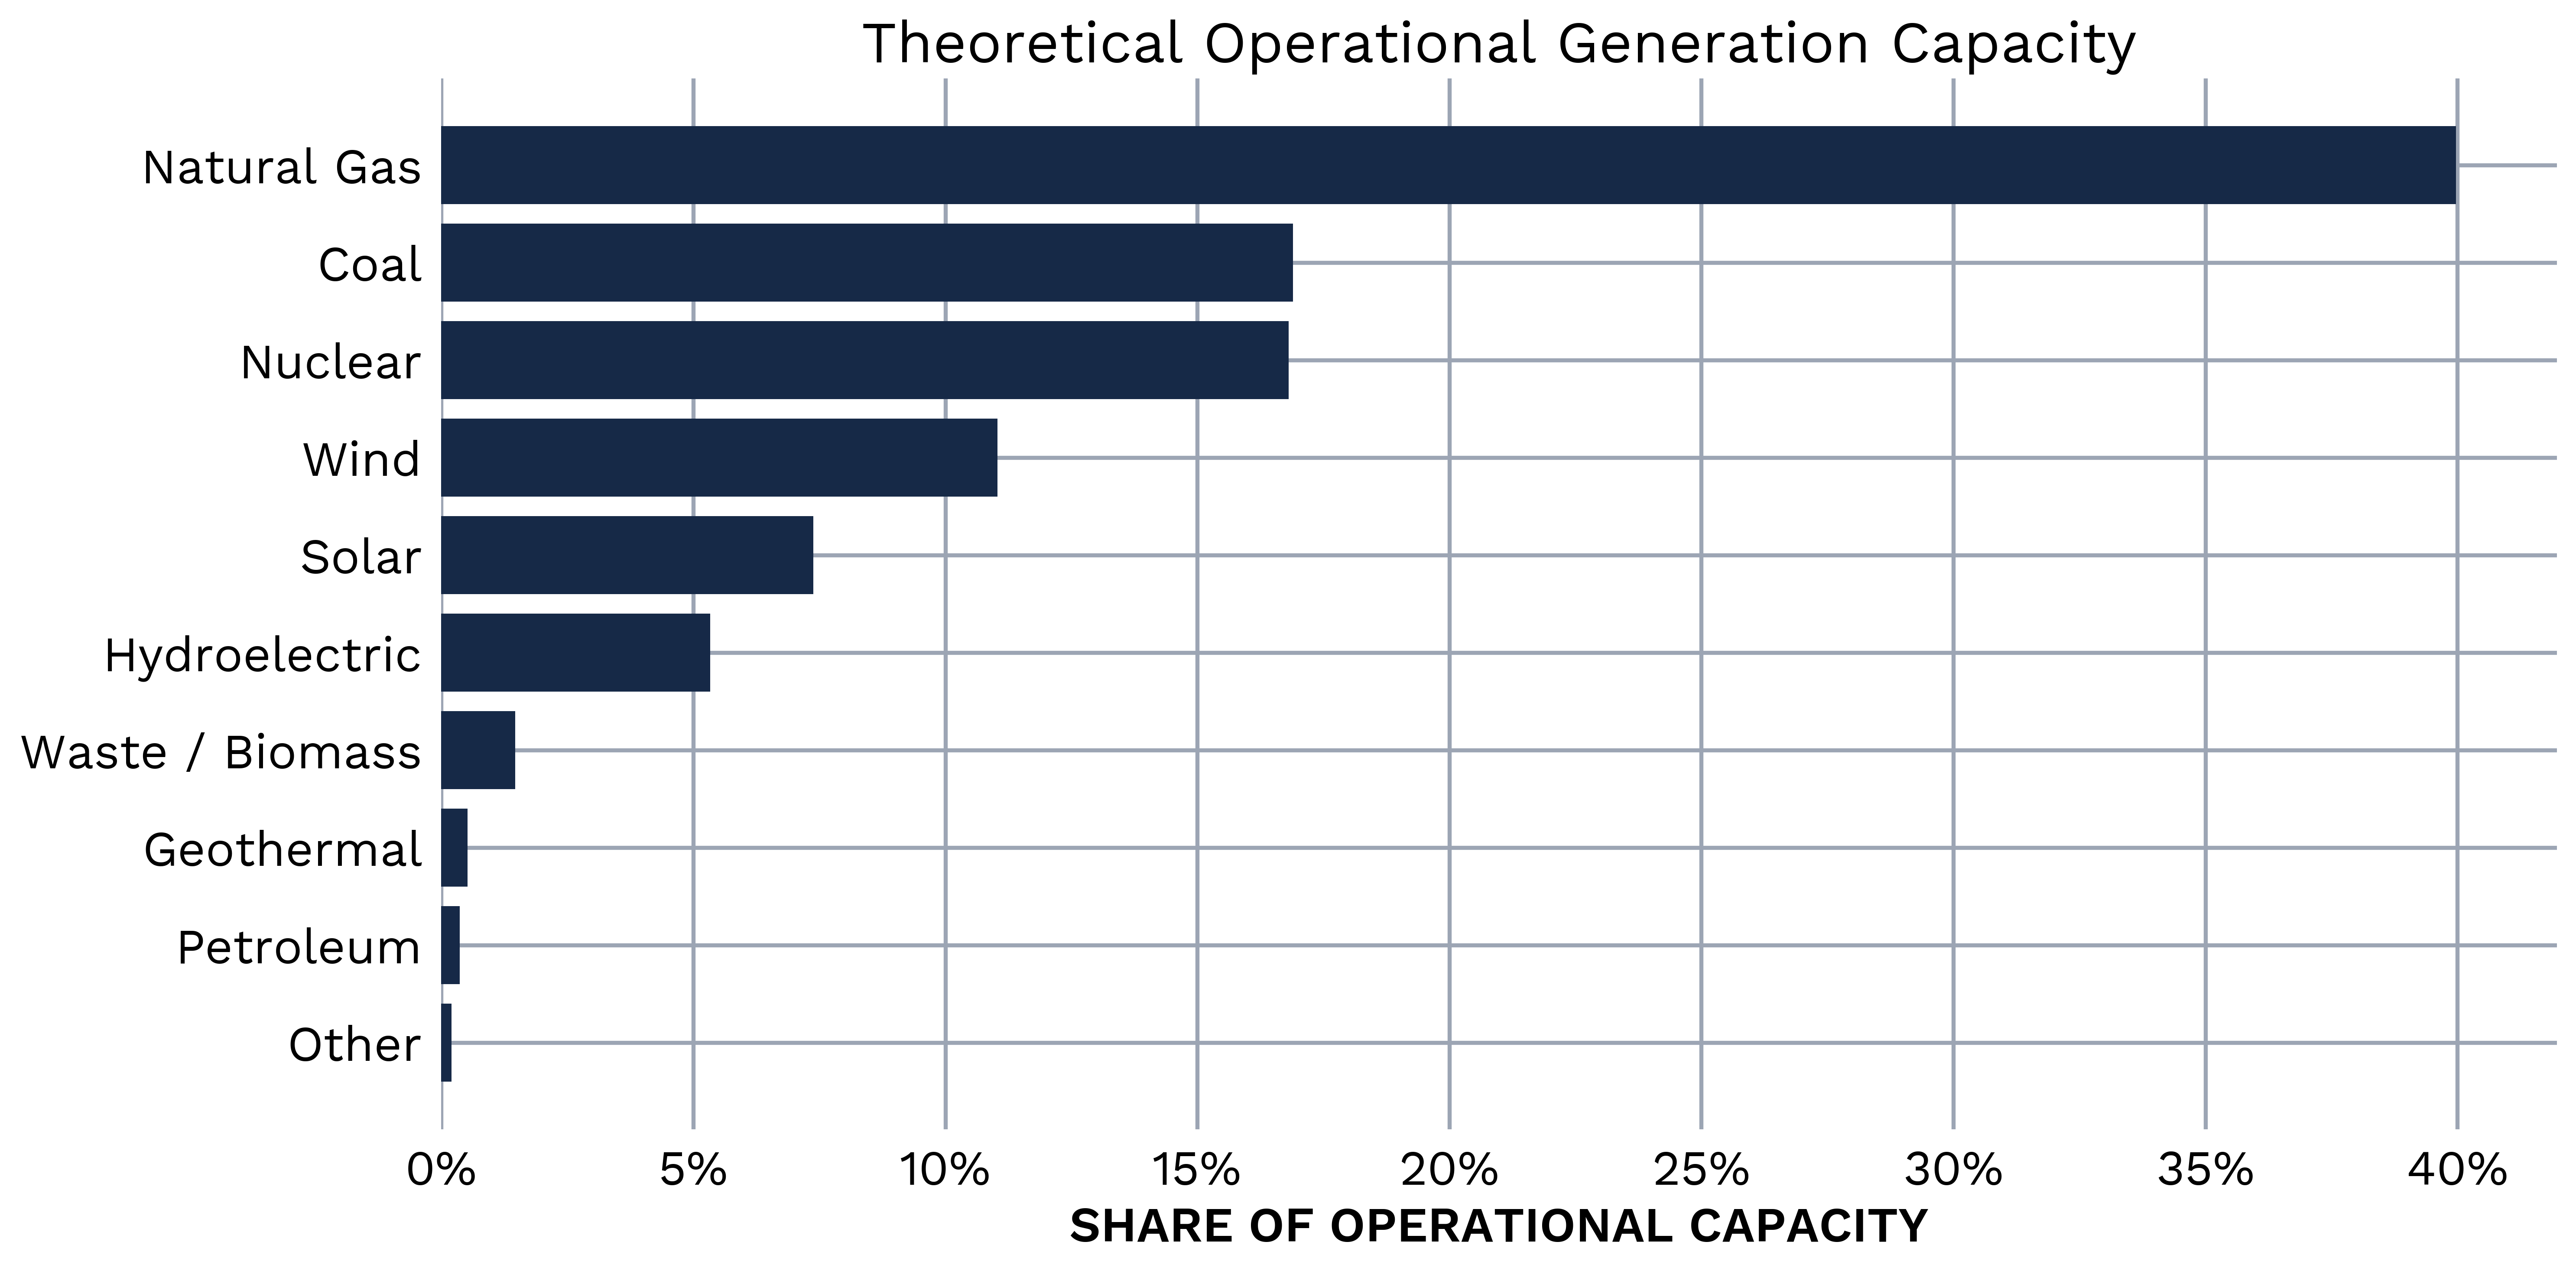
The current backlog of projects won’t be complete for a few years and, even then, we will not see a major shift in the generation composition. While new projects can be added any day and recent trends heavily favoring renewable generation may continue, these generation projects take time to complete. Furthermore, our above analyses simply rely on the latest estimated operational date, which as we discuss below, is not reliable.
Planned Project Delays
Above, we charted the planned additional capacity using the estimated operational dates as provided by project developers in the EIA filings. By analyzing iterative monthly and annual reports, we can determine individual project timelines based off of reported statuses and track how each project’s estimated timeline changes. The visual below charts theoretical cumulative capacity additions for all planned projects, contrasting the latest estimated operational dates against the original estimated dates as initially filed for each project:
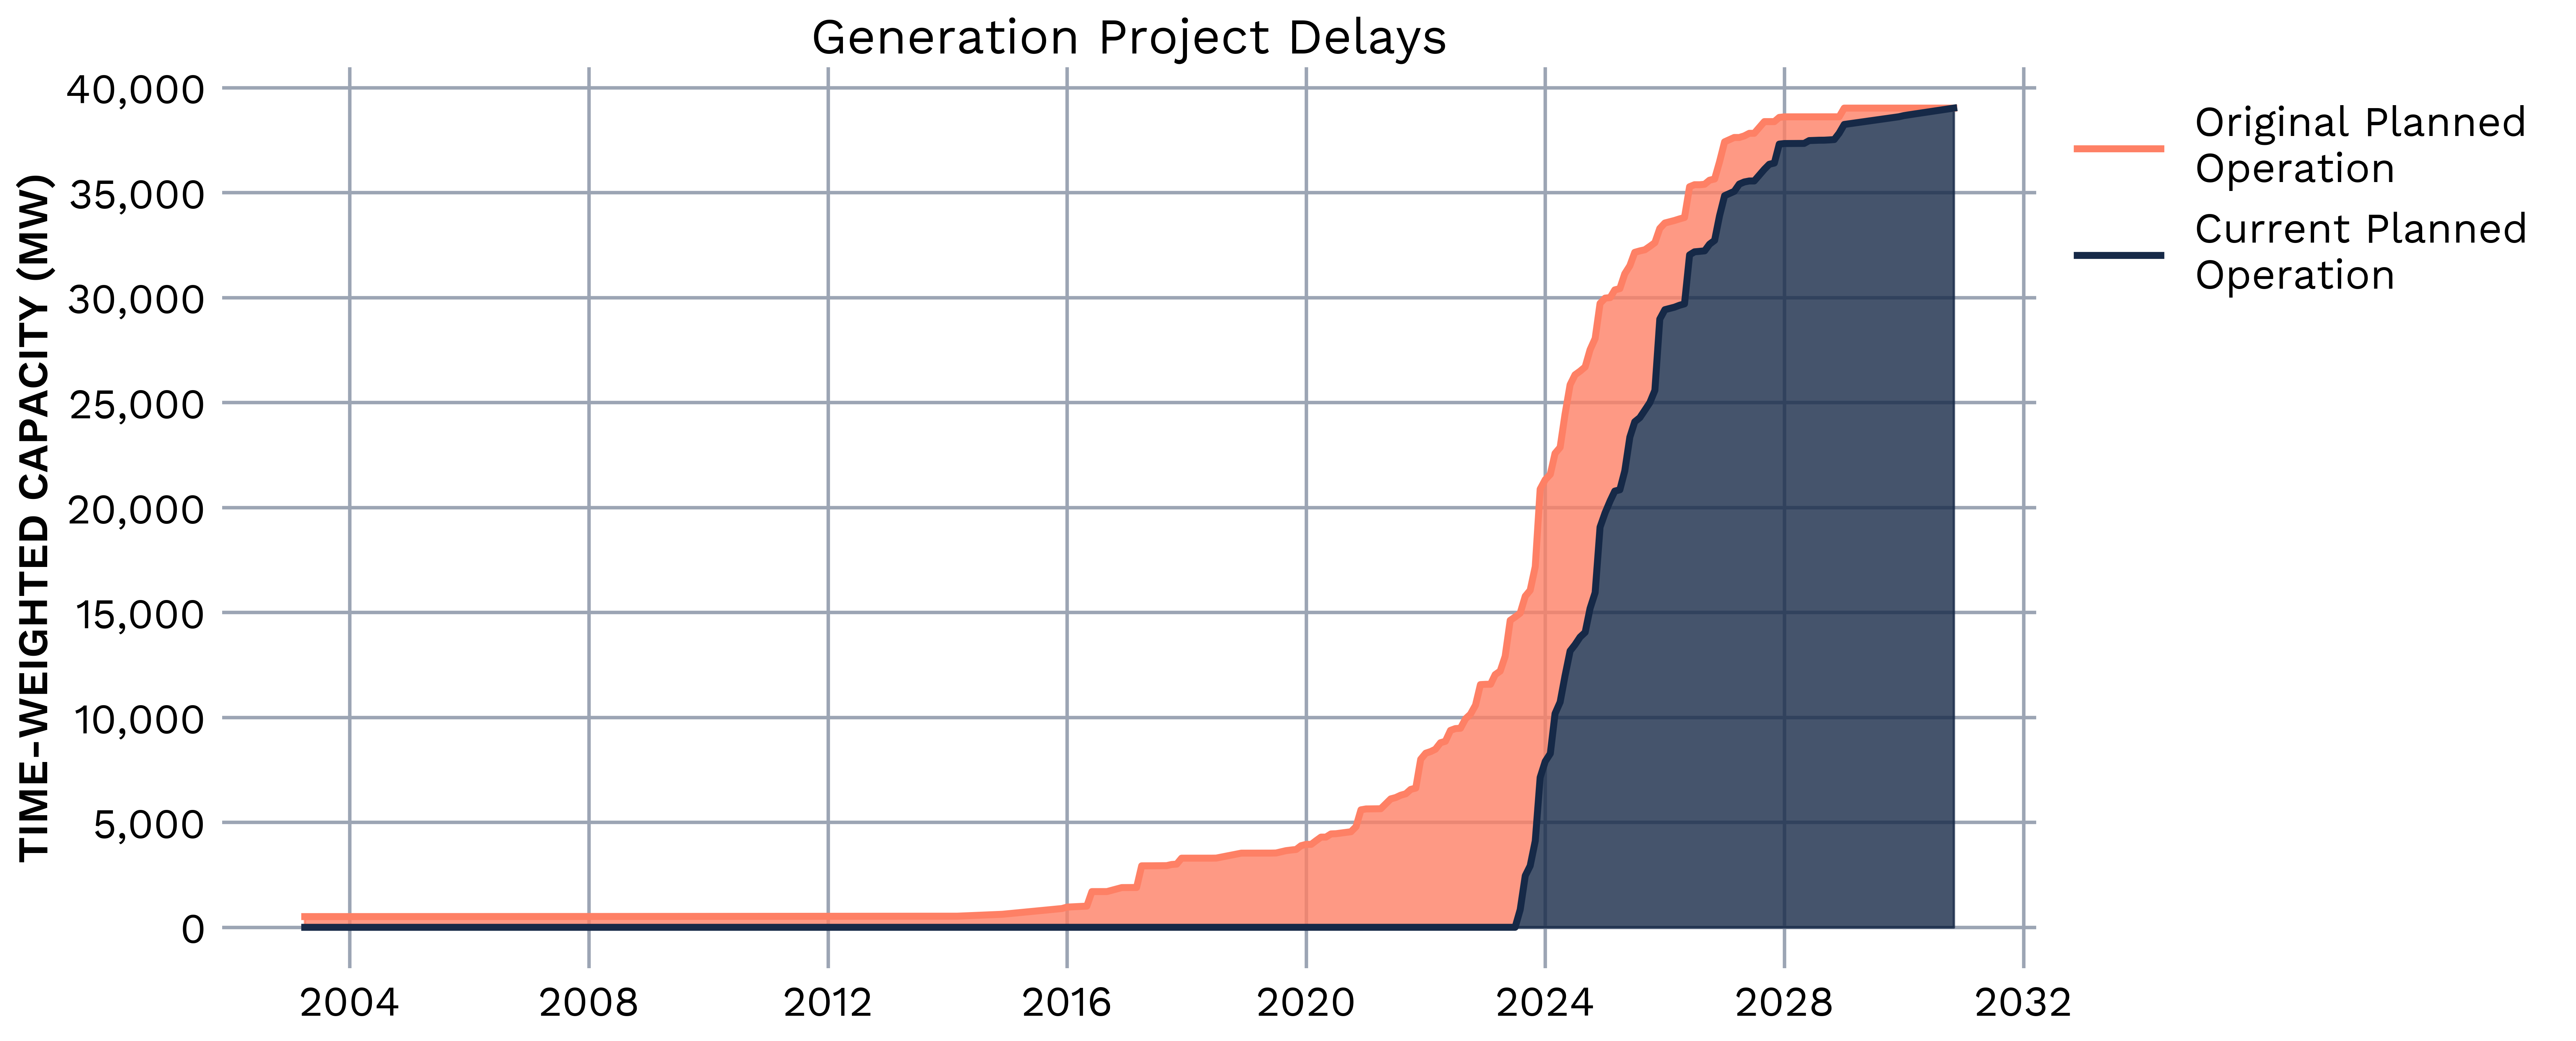
The area in red represents the cumulative weighted capacities of projects that have had their estimated operational dates pushed back, and have yet to see operation. As of today, about 15,000 MW of time-weighted capacity is already overdue according to original estimated operational dates. When we take into account all planned projects that have had their estimated operational date revised to a later date, that number is over 22,000 MW of total capacity. This accounts for over 50% of the total planned capacity, suggesting the realization of planned capacity is most likely even further out than the sponsors are currently projecting.
While delays in energy infrastructure buildout are nothing new, we can help you separate the rhetoric from the reality as the energy evolution continues in electric generation, just as we have done for the pipeline expansion that occurred in the last decade.
If you are interested in historic project timelines, forecasted operational dates, or related power generation data and analysis, please contact us.