What’s the issue?
Each year the natural gas pipelines are required to file an annual report with FERC which provides much more granular detail about their operations than is generally available, even for the publicly traded parent companies.
Why does it matter?
If one is trying to assess the health of a particular pipeline or the parent company of a group of pipelines, this data can provide insights about the growth prospects or declines in revenue not otherwise publicly available.
What’s our view?
Looking only at the companies that reported in each of the last three years, 2018 to 2020, we see that there was substantial revenue growth for the industry in 2019 over 2018, but that the growth generally plateaued in 2020. Looking deeper into Kinder Morgan as an example, we can see that its growth rate from 2018 to 2019 was slightly below the industry and similarly plateaued in 2020.
Each year the natural gas pipelines are required to file an annual report with FERC which provides much more granular detail about their operations than is generally available, even for publicly traded companies. This data is critical if one is trying to assess the health of a particular pipeline or the parent company of a group of pipelines. It can be used to determine whether the pipeline’s revenue is growing or shrinking, the breakdown of that income between tariff rate services, discounted services and negotiated rate services, and even the throughput of the pipeline for each category of those services.
Today we look in aggregate at the 135 companies that reported in each of the last three years, 2018 to 2020, to gauge the health of the overall industry, but then dive a bit deeper into the pipelines owned entirely or in part by Kinder Morgan. Overall, we see that the industry’s revenue grew by almost 8% in 2019 over 2018, but that the growth generally plateaued in 2020. Kinder Morgan’s performance was slightly below the industry as a whole in both years.
Growth Was Substantial But Then Plateaued
One hundred and thirty-five natural gas pipeline and storage companies filed annual reports in each of the last three years. By combining each of those individual reports, we can get a picture of the overall health of the natural gas pipeline and storage industry.

As seen above, these companies reported a substantial increase in overall revenue between 2018 and 2019, jumping from just over $26 billion to just over $28 billion, an increase of almost 8% year over year. However, that growth did not continue into 2020 when the industry was just able to hold income steady. Given the challenges faced during the pandemic, even that may be considered a major success, and 2021 may see a return in growth similar to that for 2019.
In each of the years, the transportation revenue, as opposed to revenue from storage or other services, was almost 90% of the total revenue for the industry.
Composition of the Transportation Revenue
The data also allows us to break the transportation revenue into the three main classes of service offered by the pipelines: tariff services, discounted services and negotiated rate services. Tariff services are as they sound, transportation provided at the pipeline’s maximum tariff rate. If that percentage is high, that is often considered an indicator of a healthy pipeline. Discounted services are those where the pipeline has felt the need to offer a price lower than its maximum rate to attract customers. An increase in these services could be an indicator that the pipeline’s overall market is declining. Negotiated rate services are contracts that the pipeline has agreed to that may or may not be below the tariff rate. A high percentage of such contracts may indicate that the pipeline has been growing through expansion projects supported by such contracts. Thus, an increase in such contracts may be a healthy sign for the pipeline.
Overall in 2019 and 2020, we see the following breakdown between these categories of services.
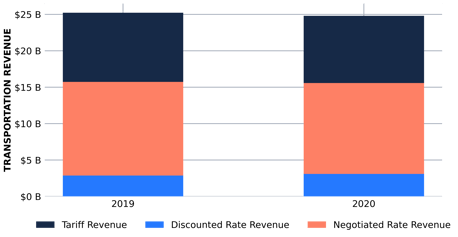
As seen above, there was an increase in the amount of discounted services being offered but that was definitely unevenly distributed across the industry. Most companies saw little increase in their revenue from discounted contracts, but ten companies, including three in the Kinder Morgan family, saw their share of revenue from such contracts increase by over ten percent.
Kinder Morgan
Using this data can provide insight into the health of a specific pipeline, but the data can also be aggregated based on the publicly held parent company of a group of pipelines. As an example, we will dive a bit deeper into the Kinder Morgan family of companies.

As seen above, the Kinder Morgan companies generally followed the industry trend of top line revenue growth between 2018 and 2019, but then experienced a leveling off in 2020. However, in both instances, the Kinder Morgan companies slightly underperformed as compared to the industry. Kinder Morgan saw a top line growth of less than 7% in 2019 as compared to the industry’s almost 8%, and in 2020, where the industry was able to eke out a slight increase, Kinder Morgan experienced a slight decrease in revenue. With respect to transportation revenue only, Kinder Morgan also saw a decrease in its revenue from 2019 to 2020, while also having to provide more discounts to keep the revenue at that reduced level.
Total Amounts Transported
Finally, the data provided for each pipeline includes information about the total dekatherms of gas transported by the companies. For the Kinder Morgan family, the amounts transported are broken down by the same three categories of service, tariff, discounted and negotiated.
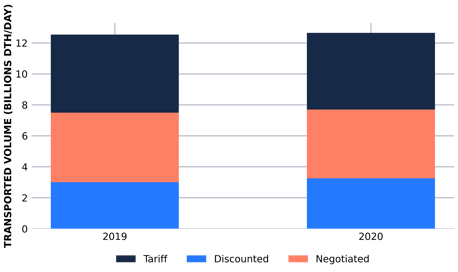
As seen above, Kinder Morgan increased the total volume of gas it transported in 2020 as compared to 2019, but the entire increase was achieved through an increase in the discounted volumes transported.